


XRP, currently trading near $3.13, is showing multiple technical and on-chain warnings that a correction might be imminent. Analysts highlight three key indicators that may trigger a downturn of up to 40–50 percent.

Inverse Cup and Handle Pattern Points to Major Drop
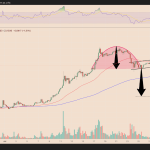
XRP appears to be forming a classic bearish inverse cup-and-handle pattern, which typically signals a trend reversal following an extended rally. The “cup” represents a rounded top and the “handle” denotes a shallow consolidation. If price breaks below the neckline (currently near $3.00), technical targets estimate a slide toward $1.20–$1.50 reflecting a 40% decline.
This setup aligns with prior analysis forecasting up to a 25% correction in early 2025. This structure mirrors previous bearish scenarios that preceded steep declines. Data shows downside targets clustering near XRP’s 200‑3D EMA at around $1.24, reinforcing downside risk.
Momentum Indicators Signal Weakness Ahead
The RSI fractal breakdown stands out. In past cycles, RSI breaches of its ascending support have led to rapid corrections. If history repeats, XRP could test the 50 day EMA near $2.75 an estimated 12% drop from current levels.

Additionally, the death cross a bearish crossover of the 50‑day moving average below the 200‑day moving average echoes momentum losses. Analysts see this confirming the downtrend, with key support near $2.20. A break below that may expose deeper targets closer to $1.10.
$140M Transfer by Ripple Co-Founder Raises Sell-Off Fears
Adding fuel to the fire, Ripple co-founder Chris Larsen recently transferred around 50 million XRP (worth nearly $140 million) to several exchange addresses. The move happened just as XRP touched $3.65, prompting speculation that insider selling might be underway.

This kind of large scale transfer often spooks investors and the market reaction was swift. XRP dropped sharply following the news, triggering liquidations in futures markets and spiking sell volume on exchanges. This wasn’t an isolated move either. In the past, similar high-volume wallet transfers have preceded sharp price corrections, especially when they happen near local highs.
On-chain analysts are now pointing to XRP’s realized price the average purchase price of all tokens held as a potential magnet for a reversion. That level currently sits near $2.40, the same target as the inverse cup and handle breakdown.
Insider Transfers and Realized Price Magnet
Following the transfer, XRP retraced into the $3.08 to $3.15 support band, and volume spiked on exchanges as stop-losses were triggered. Price volatility surged, and futures liquidations totaled over $80M in just hours.

Onchain data also highlights the realized price metric, which averages the last on‑chain cost basis of XRP holders. Currently sitting around $2.40, it often acts as a gravitation point during corrections. A meaningful breakdown could draw price toward this level.
Sentiment is Mixed as Community Watches Key Support Levels
The XRP community remains split. Some argue that the recent correction is just a healthy pause in a longer-term uptrend. Others, however, see warning signs stacking up. Technically, $3.00 is the most important support level right now. A confirmed breakdown below that point could trigger panic selling, dragging XRP toward $2.75 or even $2.40.
At the same time, bulls will be looking for a decisive bounce above $3.25. That would invalidate the bearish setup and possibly reopen the path toward new highs. Meanwhile, the broader crypto market is watching global liquidity trends. Growing money supply could support digital assets like Bitcoin and XRP. But XRP needs to hold its ground technically to benefit.
Do You Think Its Time to Be Cautious?
With bearish chart patterns, weakening momentum, and insider transfers weighing on sentiment, XRP is at a critical juncture. Still, longer-term investors may see any drop toward $2.40 as a possible re entry point, especially if it aligns with realized value. The market is watching and we think you should too.
| Indicator | Current Signal | Potential Target |
| Inverse Cup-and-Handle | Active near $3.00 neckline | 25–40% drop to $1.20–$1.50 |
| RSI breakdown fractal | Breaking ascending support | Weakness toward $2.75 |
| Realized price attraction | XRP trades above $2.40 | May gravitate lower |
Discover more from Being Shivam
Subscribe to get the latest posts sent to your email.